


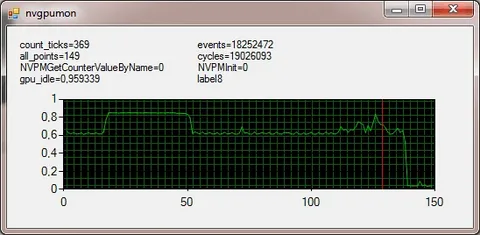
NVMonitor is a name used for software and utilities designed to monitor NVIDIA GPU and system performance. The exact features depend on the specific NVMonitor project or application, because the name is not limited to one universally recognized NVIDIA product.
Modern NVMonitor-style tools can display information such as GPU utilization, temperature, power consumption, clock speeds, memory usage, and GPU processes. Some versions also provide logging, historical charts, and troubleshooting information for identifying performance or thermal problems.
For anyone working with an NVIDIA graphics card, a monitoring utility can be useful for understanding how the GPU behaves during gaming, rendering, AI workloads, benchmarking, or everyday use. This guide explains what NVMonitor means, how these tools work, their main features, and what beginners should know before using one.
What Is NVMonitor?
NVMonitor generally refers to a monitoring utility that collects information from an NVIDIA GPU and presents it in a readable format.
One current open-source project named nv-monitor, for example, is a lightweight Linux terminal system monitor that provides CPU, memory, GPU, and process information. It supports NVIDIA hardware across several architectures, including x86_64 and ARM-based systems.
Another project called nvmonitor focuses more specifically on NVIDIA GPU throttle conditions. It can monitor power usage, GPU clocks, utilization, temperature, and active throttle reasons, while also providing optional CSV logging.
Because several projects use similar names, it is important to identify which NVMonitor application or repository you are actually using before assuming that a particular feature is available.
How Does NVMonitor Work?
An NVIDIA monitoring utility normally obtains hardware information through NVIDIA’s driver interfaces.
One important technology behind many monitoring applications is the NVIDIA Management Library (NVML). NVIDIA describes NVML as a C-based interface for monitoring and managing GPU states, and it is also the underlying library used by NVIDIA’s nvidia-smi utility.
Some NVMonitor implementations can communicate with NVML directly. Others can fall back to nvidia-smi, NVIDIA’s official System Management Interface, to retrieve information from supported GPUs.
The monitoring program periodically collects these values and converts them into a dashboard, terminal display, log file, or other format that makes hardware behavior easier to understand.
What Information Can NVMonitor Display?
The information depends on the particular implementation, but NVIDIA monitoring tools can expose a wide range of useful measurements.
GPU utilization indicates how heavily the graphics processor is being used. Temperature shows the GPU’s thermal state, while power consumption provides an indication of how much electrical power the GPU is drawing.
Clock speeds can reveal the operating frequency of the GPU, while memory statistics can show how much VRAM is being used. NVIDIA’s NVML documentation lists GPU utilization, temperature, fan speed, identification information, and error information among the states that applications can query.
GPU Utilization Monitoring
GPU utilization is one of the most useful metrics for gamers and performance enthusiasts.
A high utilization percentage generally means the GPU is actively working on a demanding workload. A low GPU utilization percentage during a game, however, does not automatically mean there is a problem because the workload may be limited by the CPU, frame rate settings, application behavior, or another component.
Monitoring utilization alongside CPU usage, temperature, clock speed, and frame rate gives a much clearer picture of overall system performance.
Temperature Monitoring
Temperature monitoring helps users understand how their graphics card behaves under different workloads.
During demanding games or rendering tasks, GPU temperatures naturally rise. Monitoring the temperature over time can help identify unusual thermal behavior, especially when performance starts dropping or clock speeds become unstable.
A monitoring application should therefore be viewed as a diagnostic tool rather than simply a temperature display. Trends are often more useful than a single temperature reading.
Power Consumption
Power monitoring shows how much electrical power the GPU is drawing.
This can be particularly useful when testing demanding workloads, comparing performance profiles, or investigating power-related throttling. Some NVMonitor implementations specifically identify power-limit conditions and distinguish them from thermal limitations.
Power readings should always be interpreted in the context of the particular GPU model because different graphics cards have different power characteristics.
Clock Speed Monitoring
GPU clock speed is another important performance indicator.
Modern NVIDIA GPUs dynamically adjust their clock frequencies depending on workload, temperature, power availability, and other conditions. A changing clock speed is therefore not necessarily a sign of instability.
If clocks repeatedly fall while temperature or power-limit indicators rise, however, monitoring data can help explain why performance is changing.
GPU Memory Monitoring
VRAM usage can be especially important for modern games, 3D applications, video editing, and AI workloads.
When an application approaches the available graphics memory, performance can sometimes become less consistent depending on how the workload manages memory. Monitoring VRAM usage allows users to identify whether memory capacity may be contributing to performance problems.
Some modern terminal monitoring tools display GPU memory alongside utilization, temperature, power draw, and clock speed.
GPU Process Monitoring
Some NVMonitor implementations go beyond basic hardware statistics and show which applications are using the GPU.
For example, the current open-source nv-monitor project can display process IDs, users, workload types, CPU usage, GPU memory allocation, and command information for GPU-related processes.
This can be particularly useful on Linux systems where multiple applications or users may be sharing the same GPU.
Throttling Detection
One of the more advanced uses of an NVIDIA monitoring tool is identifying why a GPU is not maintaining a particular performance level.
A GPU can reduce performance for several reasons, including thermal conditions or power limitations. The nvmonitor project specifically reads NVIDIA throttle information and translates certain conditions into human-readable descriptions.
This makes monitoring useful when a user notices that a GPU performs well initially but slows down during a long workload.
Logging and Historical Monitoring
Real-time information is useful, but historical data can provide an even better understanding of system behavior.
Some NVMonitor tools allow statistics to be saved to CSV files. This makes it possible to examine GPU temperature, utilization, power consumption, clock speed, and other measurements over a longer period.
Historical logging can help identify patterns that are difficult to notice when watching a live dashboard.
NVMonitor for Gaming
Gamers can use GPU monitoring software to understand how their graphics card behaves during demanding games.
For example, monitoring GPU utilization alongside temperature and clock speed can help determine whether the graphics card is being fully utilized. If GPU usage remains low while frame rates are also low, the limitation may be elsewhere in the system.
Monitoring can also help identify thermal or power-related performance changes during long gaming sessions.
NVMonitor for AI and Compute Workloads
GPU monitoring is equally valuable outside gaming.
Machine learning, CUDA applications, scientific computing, rendering, and other GPU-intensive workloads can generate sustained hardware activity. Monitoring GPU utilization, memory consumption, temperature, power draw, and processes helps administrators understand how efficiently the hardware is being used.
This is especially important when several workloads share one GPU or when systems operate continuously.
NVMonitor vs. NVIDIA-SMI
NVMonitor-style applications and NVIDIA-SMI have overlapping purposes, but they are not necessarily the same tool.
NVIDIA-SMI is NVIDIA’s official command-line system management interface. It supports monitoring and management functions for supported NVIDIA devices and can output information directly or in formats such as CSV and XML.
NVMonitor projects can instead provide a more specialized or user-friendly presentation. Some add historical graphs, simplified status information, throttle explanations, CSV logging, or process displays.
For advanced troubleshooting, NVIDIA-SMI remains an important official utility, while third-party monitoring tools can provide alternative interfaces and workflows.
Is NVMonitor an Official NVIDIA Product?
This depends on which software the name refers to.
NVIDIA itself has offered official monitoring software, including NVIDIA System Monitor, which was designed to provide real-time monitoring of PC component characteristics and system status.
However, current projects named nv-monitor or nvmonitor can be independent open-source applications. For example, the GitHub-based nv-monitor project identifies itself as a lightweight NVIDIA telemetry and terminal system monitor and is distributed under the MIT license.
Therefore, users should check the developer, repository, documentation, and download source before installing software called NVMonitor.
Is NVMonitor Safe?
The safety of NVMonitor depends on the exact application and where it was obtained.
Open-source projects with publicly available source code can make it easier for users and developers to inspect how the software works. However, users should still download applications from trusted project pages or established software repositories rather than random download websites.
It is also important to avoid modified installers or unofficial copies that may bundle unwanted software.
Common Uses of NVMonitor
NVMonitor-style tools are useful for troubleshooting GPU temperatures, checking utilization during games, examining VRAM usage, identifying GPU-heavy processes, investigating power limitations, and recording hardware statistics over time.
They can also be useful for benchmarking because monitoring data helps explain performance differences between workloads or configurations.
For system administrators and developers, continuous monitoring and metrics export can provide valuable information about GPU utilization on servers and workstations. Some current tools even support Prometheus metrics for external monitoring systems.
What Should Beginners Monitor?
Beginners do not need to watch every available statistic.
Start with four basic measurements: GPU utilization, temperature, GPU clock speed, and VRAM usage. Power consumption can then be added when investigating performance or power-related behavior.
Once these metrics become familiar, users can explore more advanced information such as GPU processes, throttle reasons, logging, and system-wide CPU and memory statistics.
Final Thoughts
NVMonitor is best understood as a name associated with NVIDIA-focused monitoring utilities rather than one single universal application. Different projects can provide very different interfaces and capabilities, ranging from simple GPU statistics to complete terminal dashboards with process monitoring, historical charts, logging, and throttle analysis.
For beginners, the main value of NVMonitor is visibility. Instead of guessing why a game, rendering application, or AI workload is performing differently, users can examine real hardware data and make more informed decisions.
Before installing any software called NVMonitor, verify the exact project and source. If you need an official NVIDIA diagnostic option, NVIDIA-SMI and NVIDIA’s own monitoring utilities are useful starting points, while third-party NVMonitor projects can offer additional interfaces and specialized features.
